Centrality measures used by GEM
The mode: is the value that appears most often in a set of data. Its calculation is indicated for nominal, ordinal and scale variables.
The median: central value of a distribution or number separating the higher half of a data sample, a population, or a probability distribution, from the lower half. Indicated for ordinal and scale variables.
The mean: is the arithmetic average of a set of values, or the result of the sum of all the values of a variable divided by the total number of observations. Only indicated for scale variables.
Dispersion measures used by GEM
Standard deviations: a measure used to quantify the amount of variation or dispersion of a set of data values. They can be used to evaluate the degree of agreement among experts when they assess a NES item.
The standard error of the mean (SEM) (i.e., of using the sample mean as a method of estimating the population mean) is the standard deviation of those sample means over all possible samples (of a given size) drawn from the population. It a key element of the confidence intervals’ calculation and allows us to judge how representative a sample is.
To calculate descriptive statistics using SPSS follow these steps:
- Analyze > Descriptive Statistics > Frequencies
- Select mode, median, mean, standard deviation and standard error of the mean
- Disable the frequency tables calculation and click accept.
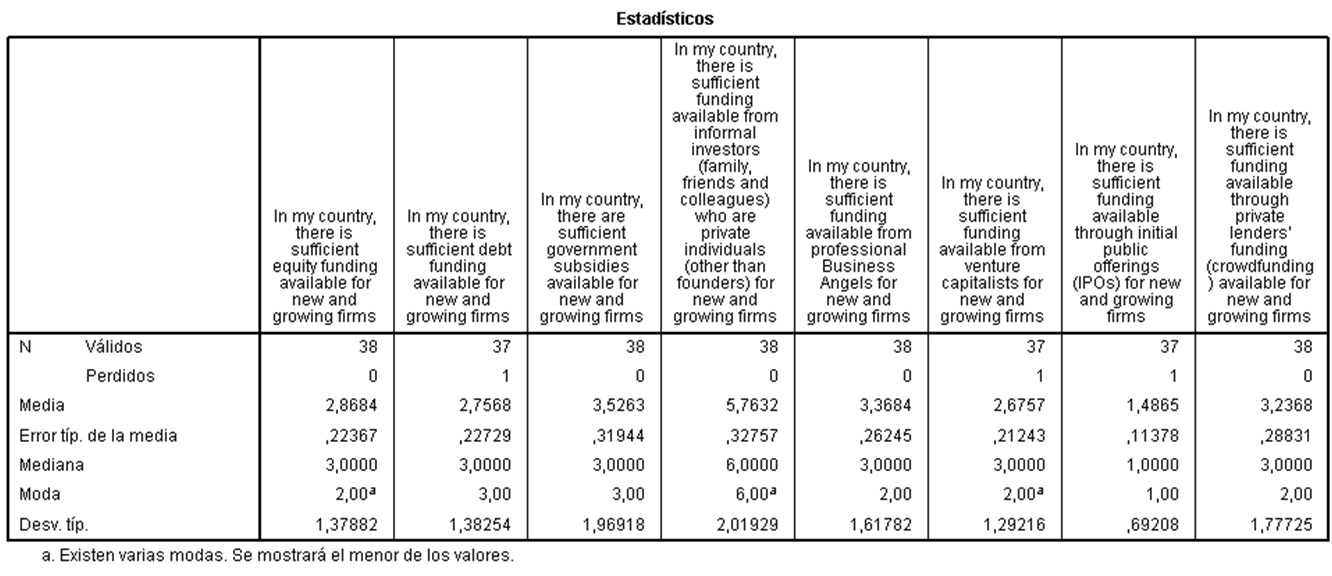
The two first rows show the number of valid and missing responses respectively for each item. All experts assessed items 1, 3, 4, 5 and 8 while 37 assessed items 2, 6 and 7
The means (third row) are over 9 points so the obtained values indicate that most of the statements are clearly false. The worst evaluation is for item 7 (IPOs) and the best is for item 4 (informal investors)
The standard errors of the mean (fourth row) are very low and this indicates that the samples are representative.
The medians ratify the information given by the mean: items 1, 2, 3, 5, 6 and 8 are moderately false in experts’ opinion, while item 4 is somewhat true and item 7 appears as completely false.
The modes offer the most frequent scores given by the experts. Thus, for items 1, 5, 6 and 8 the score 2 was the most used, for items 2 and 3 the score 3 was the most used, for item 4 the score 6 was the most frequent and for item 7, 1 was the most common score.
The standard deviations are relatively low indicating that there is a moderately strong agreement among the experts when evaluating these items. The highest degree of agreement concerns item 7 as, in average, the experts’ scores show a deviation of 0.6 points with respect to the mean and the lowest degree of agreement is for item 4 as the standard deviation is over 2 points with respect to the mean.